Evaluation
Image registration

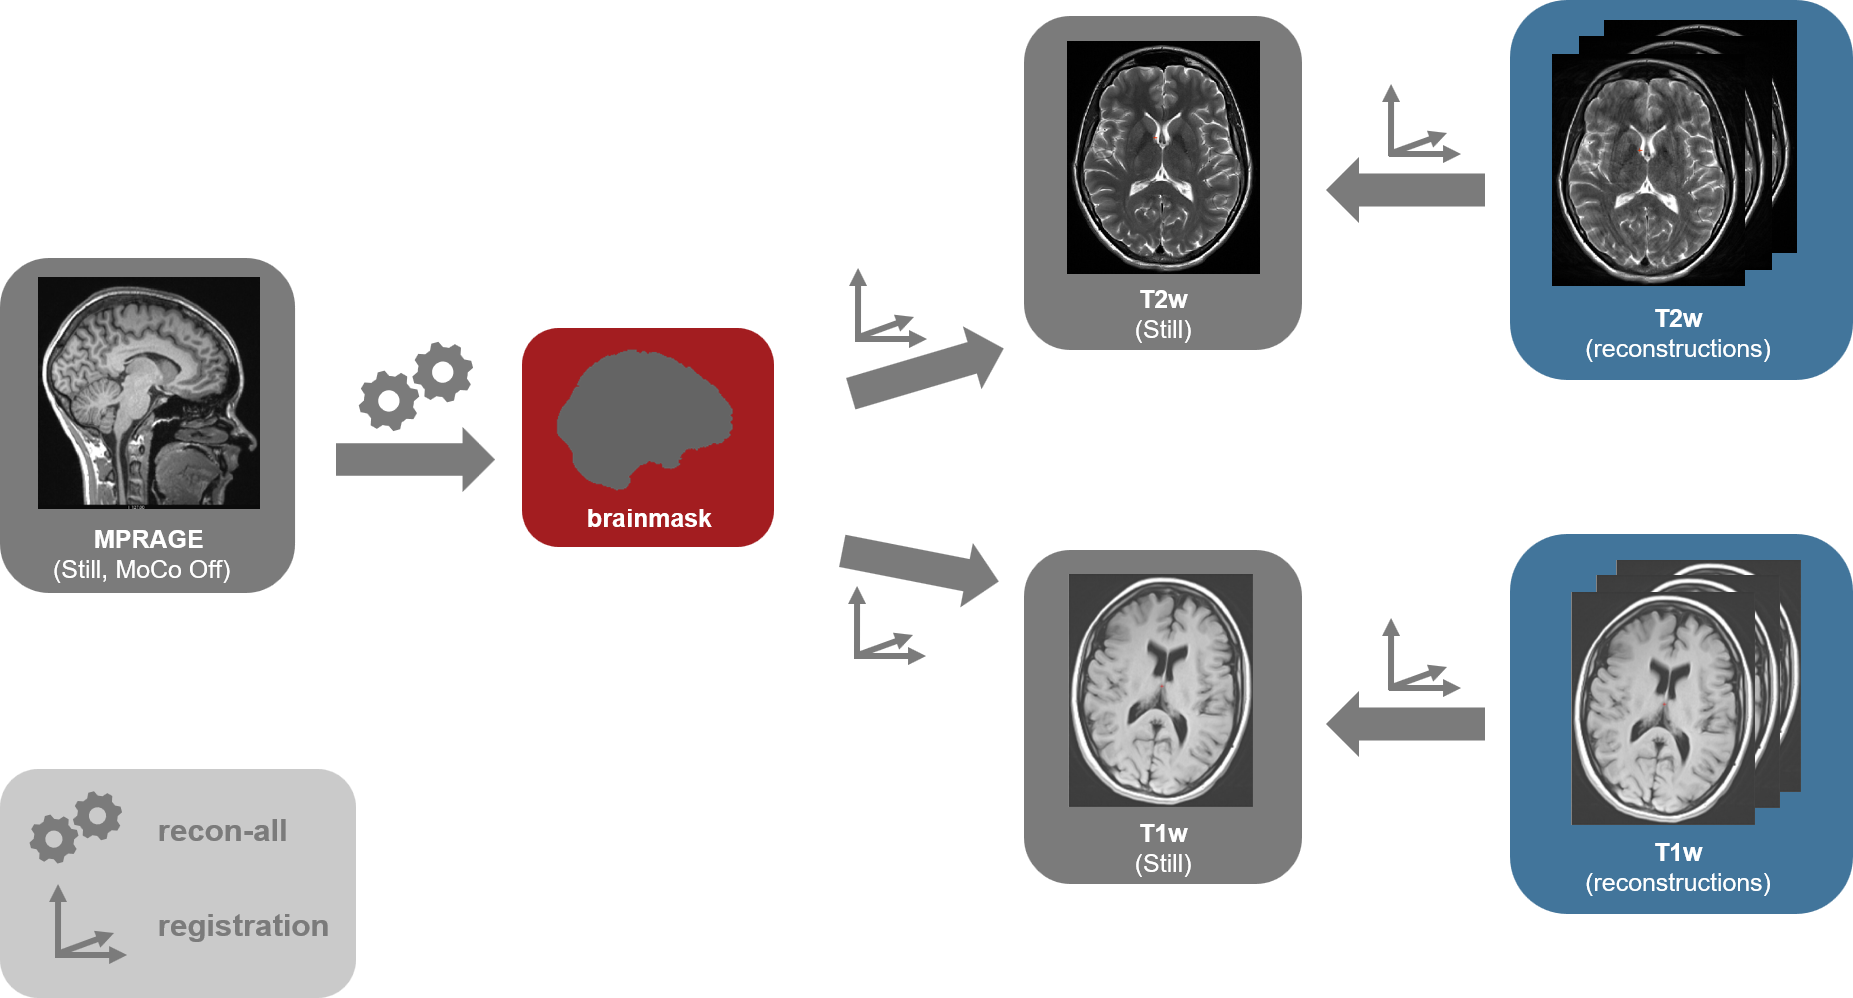
For assessing image quality of the degraded images (reconstructed by participants), still isotropic images from the same subjects will be segmented and cortical boundary delineations will be derived via FreeSurfer by the organizers. This then enables the use of FreeSurfer's registration tools for transferring the still image into the space of the degraded image (submitted by participants). A brain mask of the still, isotropic scan will be extracted by Freesurfer and then applied to the still and nodding scans of task 1 and 2.
SSIM as image quality metric
The two aligned images can then be evaluated on Structural Similarity Measure (SSIM), a popular measure developed in 2001 by Zhou Wang and Al Bovik to evaluate quality of broadcasted images. SSIM attempts to quantify changes in structural information of an image. The metric is calculated using the Evaluate_SSIM script in our GitHub repository.
Submission with missing results on test cases will be punished by setting the SSIM value for these test cases to zero.
The SSIM scores of the submitted entries will be made available on the challenge website after the challenge submission period ends.
Ranking procedure and qualitative evaluation
To identify the best performing algorithm across the test set, one proceeds in the following way: (a) For test subject k, obtain SSIM score for all algorithms. (b) For test subject k, rank the algorithms from optimal (SSIM=1) with highest rank indicating the best performance. (c) Obtain algorithm ranking for all 20 test subjects, then take the median rank of each algorithm, across all test subjects. This produces the median-rank profile.
Based on the median rank profile the top five submissions from each task will be evaluated by a panel of radiologists who will ultimately select one winner in each task. The single blind qualitative evaluation will be based on the following criteria: contrast to noise, artifacts, sharpness, and diagnostic confidence. Based on these criteria submissions will be ranked and scores averaged to determine the winners.
The quality scores (QS) are defined as follows:
QS = 5: perfect scan without artifacts
QS = 4: mild artifacts, but fully diagnostic.
QS = 3: mild to moderate artifact. If an abnormality was noticed, it would be repeated.
QS = 2: substantial artifacts. Large abnormalities can be appreciated, but it has to be repeated.
QS = 1: completely non-diagnostic.
All statistical analysis will be carried out in Python. The code is available in our GitHub repository.